The Long Tail of On-Chain Liquidity: 3,841 Positions Measured
We counted every open strategy in our catalogue on 13 November 2026. Eighty per cent had not traded a dollar in thirty days. Ten positions carried 79% of the volume. And the corridor a stablecoin treasury actually needs — USDC into USDT — was under a tenth of one per cent of it.
Aggregate numbers hide shape. A page that says “$147 million in 30-day volume” is true and almost useless: it does not say whether that depth is spread across 3,841 books or sitting in ten. For a treasury sizing a real ticket, the difference is the whole decision.
We publish our own catalogue, so we can answer the question for ourselves instead of guessing at someone else’s. This is the distribution behind the headline.
3,841 open positions, 700 makers, 887 pairs, 17 chains, $147.5M of 30-day volume.
Ten positions carry 79.1% of that volume. 3,084 positions (80.3%) reported exactly zero.
USDC appears in 877 positions and $25.3M of volume — but USDC/USDT is 137 positions and $101,724, or 0.07% of volume. Every stablecoin-to-stablecoin pair combined reaches 212 positions and 0.08%. The dollar-to-dollar corridor is the thinnest part of the book.
1. What exactly was measured
The dataset is the open strategy set we index, as of 13 November 2026: rows marked active with a resolved pair, one row per strategy. Volumes were refreshed at 12:06 UTC, the strategy rows at 06:01 UTC.
These are Aqua strategies — 1inch’s shared liquidity layer, where a single wallet balance can stand behind several strategies at once instead of being fragmented across them.2 That design matters for reading the numbers below: a position is not a pile of capital, it is a claim on capital that may also back other positions.

What this is not: it is not the whole on-chain liquidity market, and it is not all stablecoin flow. It is one shared-liquidity layer, measured honestly. Where the finding is about that layer, we say so.
2. The spike: ten positions, four fifths of the volume
Sort every position by 30-day volume and add them up from the top. The concentration is not gradual — it is almost total within the first few dozen.
| Positions, ranked by 30d volume | Share of total volume | Running total |
|---|---|---|
| Top 1 | 15.4% | $22.7M |
| Top 5 | 53.7% | $79.2M |
| Top 10 | 79.1% | $116.6M |
| Top 25 | 96.4% | $142.2M |
| Top 50 | 97.7% | $144.2M |
| Top 100 | 99.2% | $146.3M |
| All 3,841 | 100% | $147.5M |
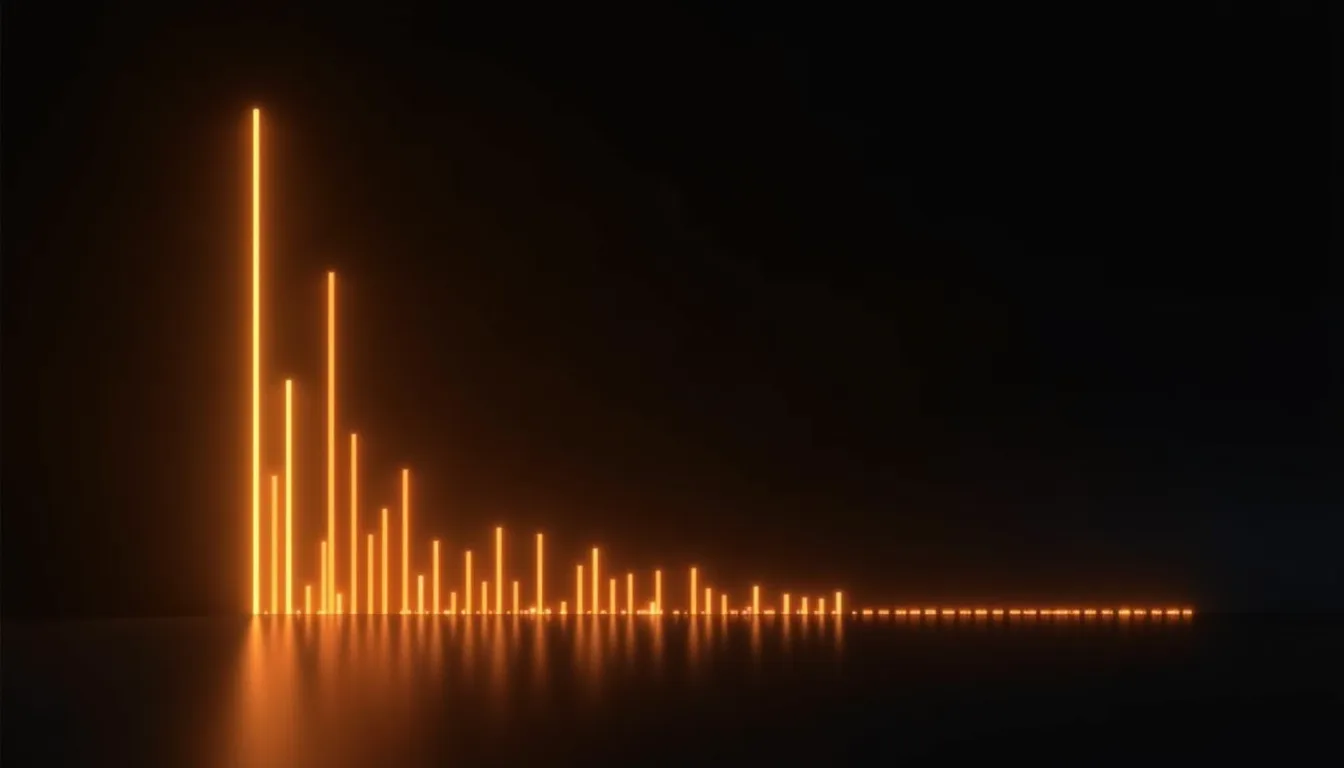
The top ten are all one pair family on one chain. Every one of them is 1INCH/… on Ethereum: WBTC, USDC, AAVE, wstETH, and again WBTC and AAVE further down the list. The largest single position — 1INCH/WBTC — is 15.4% of all volume by itself.
That is worth stating plainly rather than dressing up: the open shared-liquidity layer is currently dominated by the protocol’s own pairs. It is what an early venue looks like. It also means the aggregate is a market-making statistic, not a statement about the corridors a treasury uses.
3. The tail: 80% of the book is silent
Of the 3,841 positions, 3,084 reported exactly zero 30-day volume. Not a small number, not an unreported one: zero, as of a volume refresh that ran the same morning.
| 30-day volume per position | Positions | Share |
|---|---|---|
| $0 | 3,084 | 80.3% |
| under $100 | 374 | 9.7% |
| $100 – $1,000 | 154 | 4.0% |
| $1,000 – $10,000 | 86 | 2.2% |
| $10,000 – $100,000 | 116 | 3.0% |
| $100,000 – $1M | 12 | 0.3% |
| over $1M | 15 | 0.4% |
Only 757 positions traded at all in thirty days. Among those, the median position did $101.78. The ninetieth percentile was $40,290 — so even inside the “active” group, the typical book is a rounding error and the interesting depth lives in a handful of places.
A zero here means no executed volume, not an empty book: a position can quote continuously and never be taken. That distinction is the difference between “the liquidity is not there” and “the liquidity was not used” — and for anyone routing an order, only the first one matters.
4. Where it sits: one chain, then everything else
| Chain | Positions | 30d volume | Share of volume |
|---|---|---|---|
| Ethereum | 2,623 | $141,055,361 | 95.6% |
| Robinhood Chain | 469 | $6,247,977 | 4.2% |
| BNB Chain | 384 | $170,633 | 0.12% |
| Base | 161 | $40,877 | 0.03% |
| Arbitrum | 68 | $1,031 | <0.01% |
| Polygon | 45 | $30 | <0.01% |
| Arc | 26 | $10 | <0.01% |
| 10 further chains | 65 | $178 | <0.01% |
Ethereum holds 68.3% of the positions and 95.6% of the volume. Within Ethereum the concentration is just as sharp: the three largest positions are 39.9% of the chain’s volume.
Fifteen of the seventeen chains each carry less than 1% of total volume. That is not a reason to remove them — a chain with one live position is exactly what an early deployment looks like — but it does mean “17 chains” is a coverage claim, not a depth claim. Coverage is cheap to state and expensive to verify; depth is the opposite.
5. The stablecoin hole
Now the part that matters most for a treasury. USDC is present in 877 positions, and those positions carry $25.3M — 17.2% of the catalogue’s volume. That sounds like a stablecoin market.
It is not the market a treasury needs. The pair that moves one dollar into the other dollar — USDC/USDT — is 137 positions, 3.6% of the book, and $101,724 of volume: 0.07% of the total.

| Chain | USDC/USDT positions | 30d volume |
|---|---|---|
| Ethereum | 104 | $97,928 |
| Base | 13 | $3,513 |
| BNB Chain | 8 | $283 |
| Avalanche, Cronos, Optimism | 9 | $0 |
| Sonic, Linea | 3 | $0 |
| Total | 137 | $101,724 |
Widen it to every dollar-to-dollar pair — DAI/USDC, DAI/USDT, USDC/USDe, PYUSD/USDC and the rest — and the whole stablecoin-to-stablecoin family is 212 positions and $111,801. That is 0.08% of the catalogue’s volume.
For context on how small that is: total stablecoin supply passed $285 billion on the same day, with USDT at $175.5B and USDC at $69.5B.1 The two largest dollar tokens in the world, and the open shared-liquidity layer between them carried about a hundred thousand dollars of thirty-day flow.
Two honest caveats. First, a treasury moving USDC to USDT would also use concentrated AMMs and order books outside this layer, so this is not a statement about the whole market. Second, the thinness is partly a stage-of-life effect: Aqua opened to all users in late 2025 across 13 chains,3 and corridors fill after the venue, not before.
But the direction is worth holding onto: the deeper a stablecoin corridor needs to be, the less this layer currently offers it — and that is precisely the corridor treasuries care about.
6. Who is behind it: 700 makers, mostly one position each
The maker side is as long-tailed as the volume side.
- 700 distinct makers across 3,841 positions — a mean of 5.5 positions.
- The median maker has one position. 373 of 700 (53.3%) have exactly one.
- Fifteen makers hold 50 or more positions. The largest holds 321.
- That largest holder by count traded $16 in thirty days.
Position count and depth are close to uncorrelated here. A maker with 321 books is not a source of liquidity; it is a source of quotes. Sizing against the number of positions would be a category error, which is the same mistake as sizing against the aggregate.
Activity tells the same story from the other side: 57 positions show trading in the last 24 hours, 656 in the last 30 days. A further 3,173 carry no activity timestamp in our rollup at all — a data gap rather than proof of idleness, and one we would rather report than smooth over.
7. What a treasury should take from this
Do not size off the aggregate. “$147M of volume” and “$112K between USDC and USDT” are both true of the same catalogue. Ask for the pair, the chain, and the depth, in that order.
Expect depth in tens of positions, not thousands. The visible book that can absorb a real ticket is roughly the top 25 positions on the chain you are using. Everything after that is texture.
Route rather than pick. When the distribution is a spike plus a tail, execution quality comes from splitting across makers and re-quoting, not from finding the single best venue — because the single best venue is a large share of the book, and taking it whole moves the price.
Treat the stablecoin corridor as the hard case. Dollar-to-dollar is where the layer is thinnest, and it is also where a treasury spends most of its life. That is the corridor to measure before committing to a venue, not the one to assume.
8. Limits of this measurement
- Scope. One shared-liquidity layer, not the whole market. Concentrated AMMs and CEX order books are outside it.
- Volumes are upstream-reported and rolled up by us. We refreshed them on 13 November at 12:06 UTC and found no nulls — only zeros — so a zero is a reported zero.
- Positions are virtual. In a shared-liquidity design one balance can back several positions, so position counts and volume are not capital.
- A snapshot. One day, one 30-day window. The shape is stable across our refreshes; the exact percentages move.
The raw numbers behind every table here are public: yield.trdefi.com/stats for the aggregates, and /api/strategies for the rows.
Our API and MCP server expose this catalogue as it is — every open position, its pair, its chain and its thirty-day volume. Read-only, no key, nothing it can do moves a token.
yield.trdefi.com/mcp JSON-RPC over POST · yield.trdefi.com/docs/apiSources
- DefiLlama, Stablecoins — total supply $285.595B as of 13 November 2026 (USDT $175.511B, USDC $69.459B). defillama.com/stablecoins
- 1inch, Aqua — shared liquidity layer protocol: a registry-based allowance system where one approval and one balance can back multiple strategies. github.com/1inch/aqua
- CoinDesk, 1inch Unveils Protocol Letting Multiple DeFi Strategies Share the Same Capital (17 November 2025); public launch across 13 chains. coindesk.com
- TRDeFi catalogue snapshot, 13 November 2026 — 3,841 active strategies with resolved pairs; volumes refreshed 12:06 UTC. /api/stats